Correlation, concentration and drawdowns
Count shared exposures, not just ticker symbols, and understand the arithmetic of recovering from losses.

Many positions can still be one bet
A portfolio with ten holdings can be more concentrated than one with three if the ten share the same economic driver. Several bank shares may all react to funding stress. Different currency positions may all amount to selling the same currency. A crypto token, a token-linked company and a leveraged derivative can create overlapping exposure despite their different labels.
Begin with a simple inventory: what could cause each position to lose value? Group exposures by industry, currency, interest-rate sensitivity, liquidity, counterparty and leverage. This is not a complete quantitative risk model, but it can reveal duplication that a count of open trades misses. Legal separation between products does not ensure economic independence.
Look-through exposure adds the indirect holding to the direct one. If a $10,000 fund position has 8% invested in one company, it contains about $800 of that company at those stated weights. Owning another $2,000 of the company directly creates approximately $2,800 of combined exposure, before any derivatives or other funds are considered. The calculation uses current holdings and can change as the fund rebalances. Merely counting the fund and the share as two separate positions misses the overlap.
Correlation describes a relationship in a sample
Correlation measures the degree of linear co-movement between two return series over a chosen sample. It is not a permanent promise. The result depends on the time period, observation frequency and data quality. Assets that appeared weakly related during calm conditions may fall together during a funding squeeze or widespread liquidation.
A low historical correlation does not mean two assets cannot suffer losses at the same time. Nor does a high correlation imply identical returns: the size of each movement can differ substantially. When reviewing a portfolio, inspect both relationships and magnitudes. A small volatile position can contribute more to an adverse scenario than a larger stable-looking one.
Drawdown uses the previous peak as its reference
Drawdown is the decline from an earlier equity peak to a later value. If an account rises from $10,000 to $12,000 and then falls to $9,000, the drawdown from the peak is 25%, even though the loss from the original starting balance is 10%. Both measurements are valid, but they answer different questions.
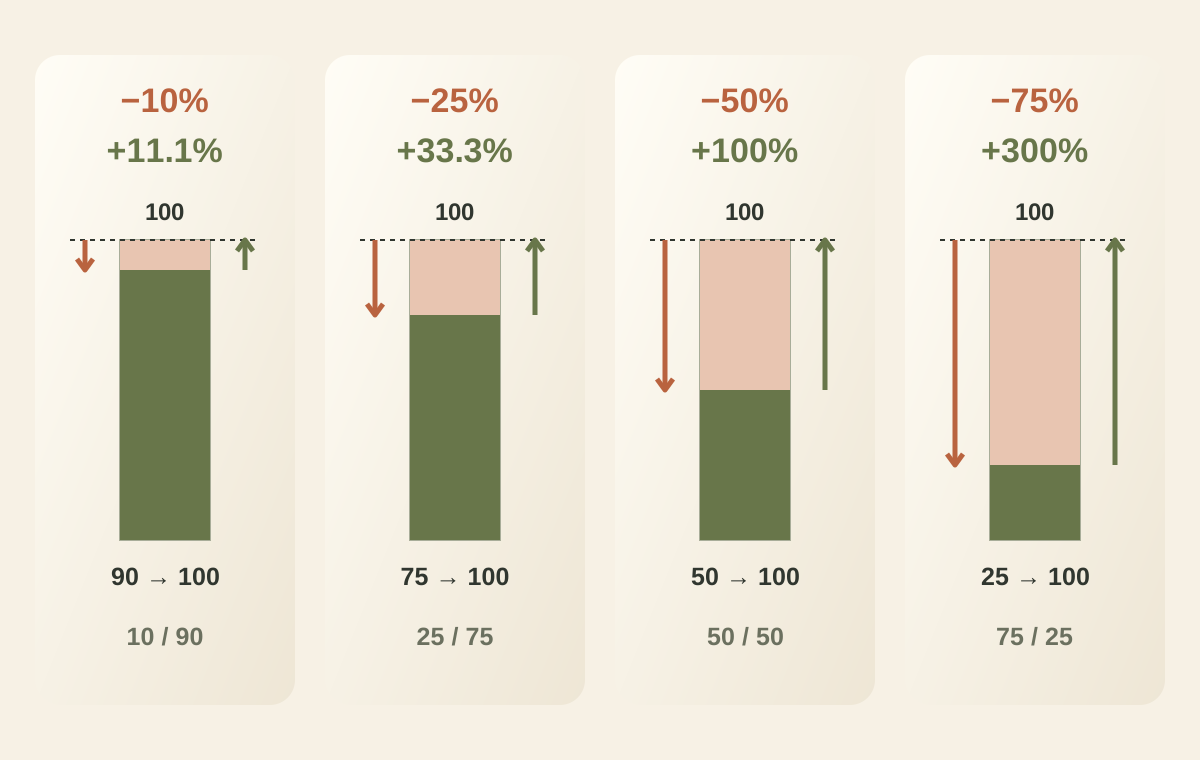
Recovery percentages are asymmetric. A 20% loss reduces $10,000 to $8,000; returning to $10,000 requires a 25% gain on the smaller base. A 50% decline requires a 100% gain. These are arithmetic identities, not forecasts. They explain why a severe loss cannot be undone by an equal positive percentage afterward.
Stress a common event
Create a hypothetical scenario affecting several holdings at once. Suppose three positions each have $2,000 of exposure and each falls 15%. The combined price loss is $900 before costs. Their separate trade plans do not change the common-event arithmetic. Leveraged exposure and forced liquidation can make the path more damaging than a simple end-of-day calculation suggests.
Diversification can reduce certain concentrated risks but cannot guarantee against market losses. Rebalancing also has costs and may create tax consequences that depend on jurisdiction. For education, compare scenarios before and after changing hypothetical weights, and explicitly state what remains unknown. The goal is to understand vulnerability, not to produce a decorative score that suggests precision without reliable inputs.
Withdrawals and deposits complicate an equity curve. Adding cash can make the account balance rise even when investments lost money, while a withdrawal can resemble a trading loss. Keep external cash flows separate from investment results before calculating drawdowns or comparing periods. A clearly labeled cash-flow-adjusted performance series is more informative than treating every change in the account balance as a market outcome.
Measure the path as carefully as the final balance
For an equity value E and its previous running peak P, drawdown as a positive loss fraction is 1 − E/P. Recalculate the running peak whenever equity makes a new high. In a hypothetical sequence of $10,000, $12,000, $11,000, $13,000 and $10,400, the final drawdown is 20% from the $13,000 peak. The ending account is still 4% above its initial value. A positive result since inception and a substantial current drawdown can therefore both be true.
Depth is not the only feature of the path. Record how long the account remains below a prior peak and whether the worst decline is still unrecovered at the end of the sample. A brief 10% decline and a 10% decline lasting several years have different implications for cash needs and the ability to continue the process. Daily closing observations also miss intraday declines, so state the measurement frequency rather than treating the reported maximum as the worst loss that could ever have occurred.
External cash flows must not be mistaken for recovery. Suppose investments rise from $10,000 to $11,000 and then $3,000 is withdrawn. The remaining $8,000 balance does not imply a 20% investment loss: the assets gained 10% before the withdrawal. Conversely, a new deposit can lift the balance above its old peak without repairing investment losses. A performance series should separate those flows, while a funding analysis still needs to track the actual cash available.
Recovery from a fractional loss d requires a gain of d/(1 − d) on the remaining capital, assuming no external cash flows. A 40% loss therefore needs about 66.7% to recover. The formula does not say how long that gain will take, whether it will happen, or what risks would be needed to pursue it. Raising exposure to force a faster recovery changes the loss distribution precisely when the account has less room to absorb another adverse outcome.